A flood light can be powerful and still fail a project. The beam may be too narrow to cover the target, too wide to deliver the required intensity, or aimed in a way that produces a bright center and dark edges. Adding more wattage does not automatically solve these problems. It may simply increase glare, spill light and connected load.
A useful preliminary calculation separates three questions:
- Coverage: How large is the beam at the target distance?
- Illuminance: How many lux reach a specific point?
- Quantity: How many luminaires may be needed to reach the project’s average target?
This guide explains the formulas, shows worked examples and identifies where hand calculations must stop and an IES/LDT-based lighting simulation must begin.
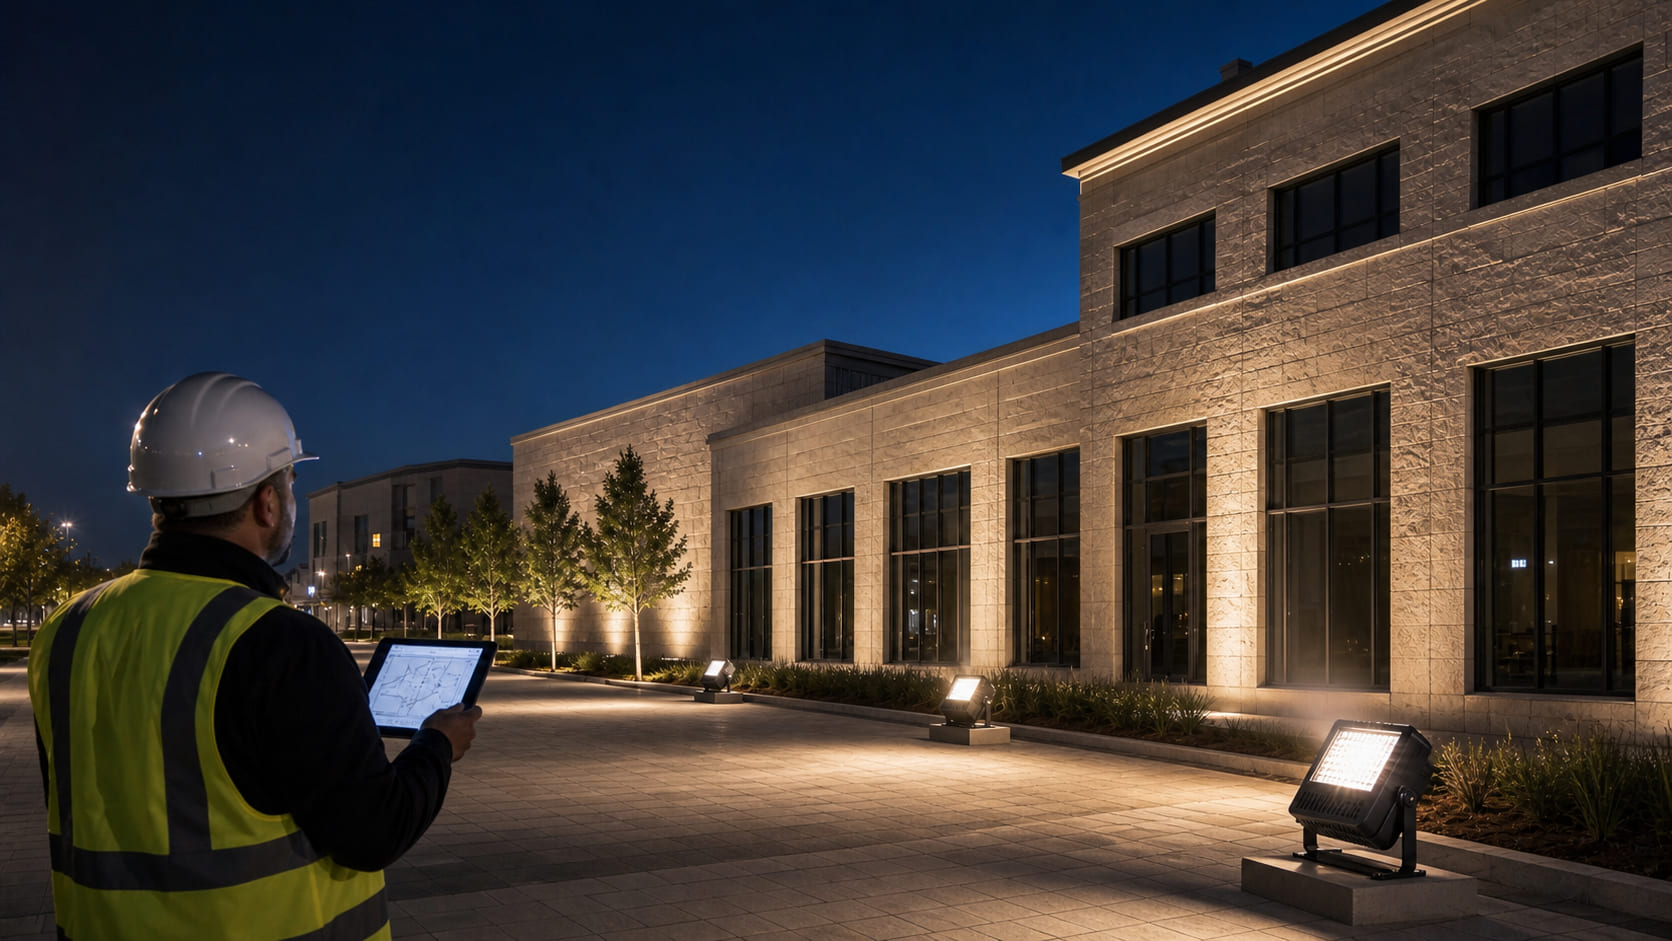
Important: The numerical examples in this article are illustrative. They are not photometric test results for a Synno product. Final calculations must use the IES or LDT file for the exact LED, optic, wattage, driver and front-cover configuration being ordered.
Quick Calculation Summary
| Question | Preliminary formula | Best input data |
|---|---|---|
| Beam width | W = 2 × D × tan(θ ÷ 2) |
Beam angle and throw distance |
| Center illuminance | E = I ÷ D² |
Center intensity in candela and distance |
| Illuminance on a tilted surface | E = I(γ) × cos(α) ÷ D² |
Intensity at the relevant angle, distance and incidence angle |
| Preliminary fixture quantity | N = Eavg × A ÷ (F × UF × MF) |
Target average lux, area, lumens, utilization factor and maintenance factor |
| Final layout | Photometric calculation | Exact IES/LDT file, aiming, surfaces, obstructions and calculation grid |
The first three formulas are useful for feasibility checks. They do not replace a full project layout.
1. Start with the Right Inputs
Before calculating, collect the data that actually affects the result.
Project geometry
- length and width of the target area;
- mounting height or setback distance;
- luminaire position;
- aiming point and tilt angle;
- target orientation: horizontal ground, vertical facade or inclined surface;
- obstructions such as trees, columns, roofs and equipment.
Lighting objective
- required average illuminance;
- minimum illuminance;
- uniformity requirement;
- vertical or horizontal calculation plane;
- operating hours and dimming scenarios;
- glare and spill-light limitations.
Luminaire data
- total luminaire lumens, not only LED-chip lumens;
- luminous intensity distribution in candela;
- beam angle and field angle;
- IES or LDT photometric file;
- wattage and driver input;
- CCT, CRI and optical configuration;
- lumen-maintenance and environmental information where applicable.
Wattage is needed for electrical loading and energy estimates. It is not enough to calculate beam coverage or lux.
2. Beam Angle and Field Angle Are Not the Same
The Illuminating Engineering Society defines beam angle using the directions where luminous intensity falls to 50% of maximum. Field angle uses the 10% points.
This means the diameter calculated from a nominal beam angle represents the approximate width between the 50% intensity directions. It is not the complete visible pool of light.
A 30° flood light may have:
- a relatively tight field with little spill;
- a broad, soft field outside the 30° beam;
- an asymmetric distribution that cannot be described by one angle;
- rings or hot spots that the nominal angle does not reveal.
For this reason, two luminaires with the same stated beam angle may illuminate very different areas.
For a broader application overview, see how beam angle changes lighting coverage.
Technical references:
3. Formula 1: Calculate Beam Width
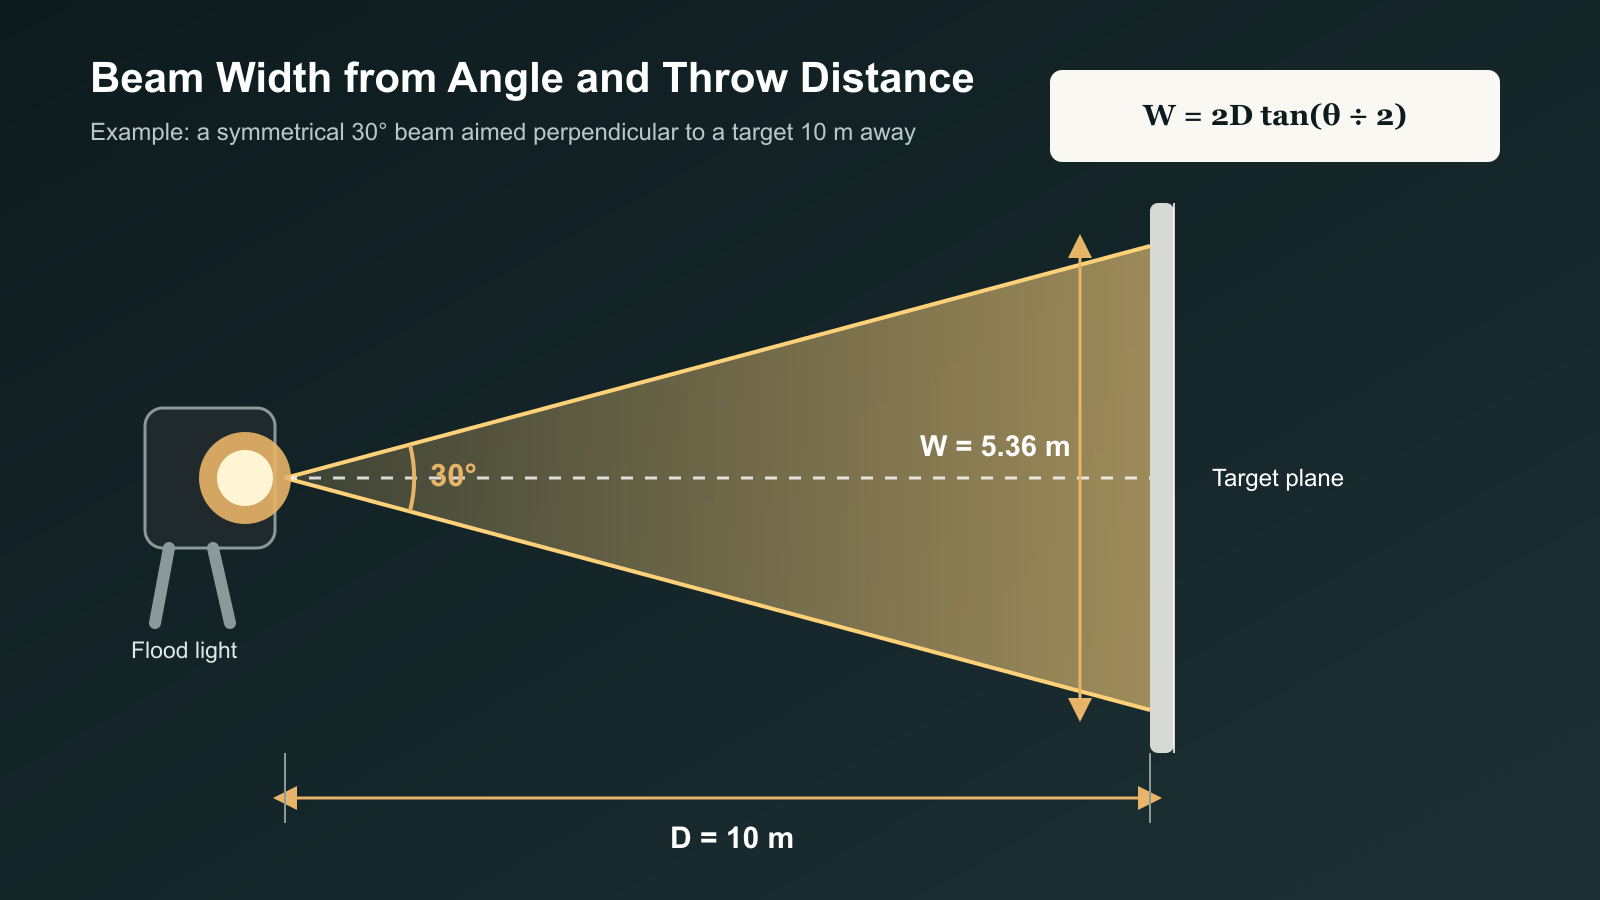
For a symmetrical beam aimed perpendicular to a flat surface:
Or:
Where:
W= beam width at the target;D= distance from the light-emitting center to the target;θ= full beam angle.
Example: 30° beam at 10 m
W = 2 × 10 × tan(15°)
W ≈ 5.36 m
At 10 m, the approximate diameter between the 50% intensity points is 5.36 m.
Beam-width reference table
| Beam angle | Width at 5 m | Width at 10 m | Width at 15 m |
|---|---|---|---|
| 15° | 1.32 m | 2.63 m | 3.95 m |
| 30° | 2.68 m | 5.36 m | 8.04 m |
| 60° | 5.77 m | 11.55 m | 17.32 m |
| 90° | 10.00 m | 20.00 m | 30.00 m |
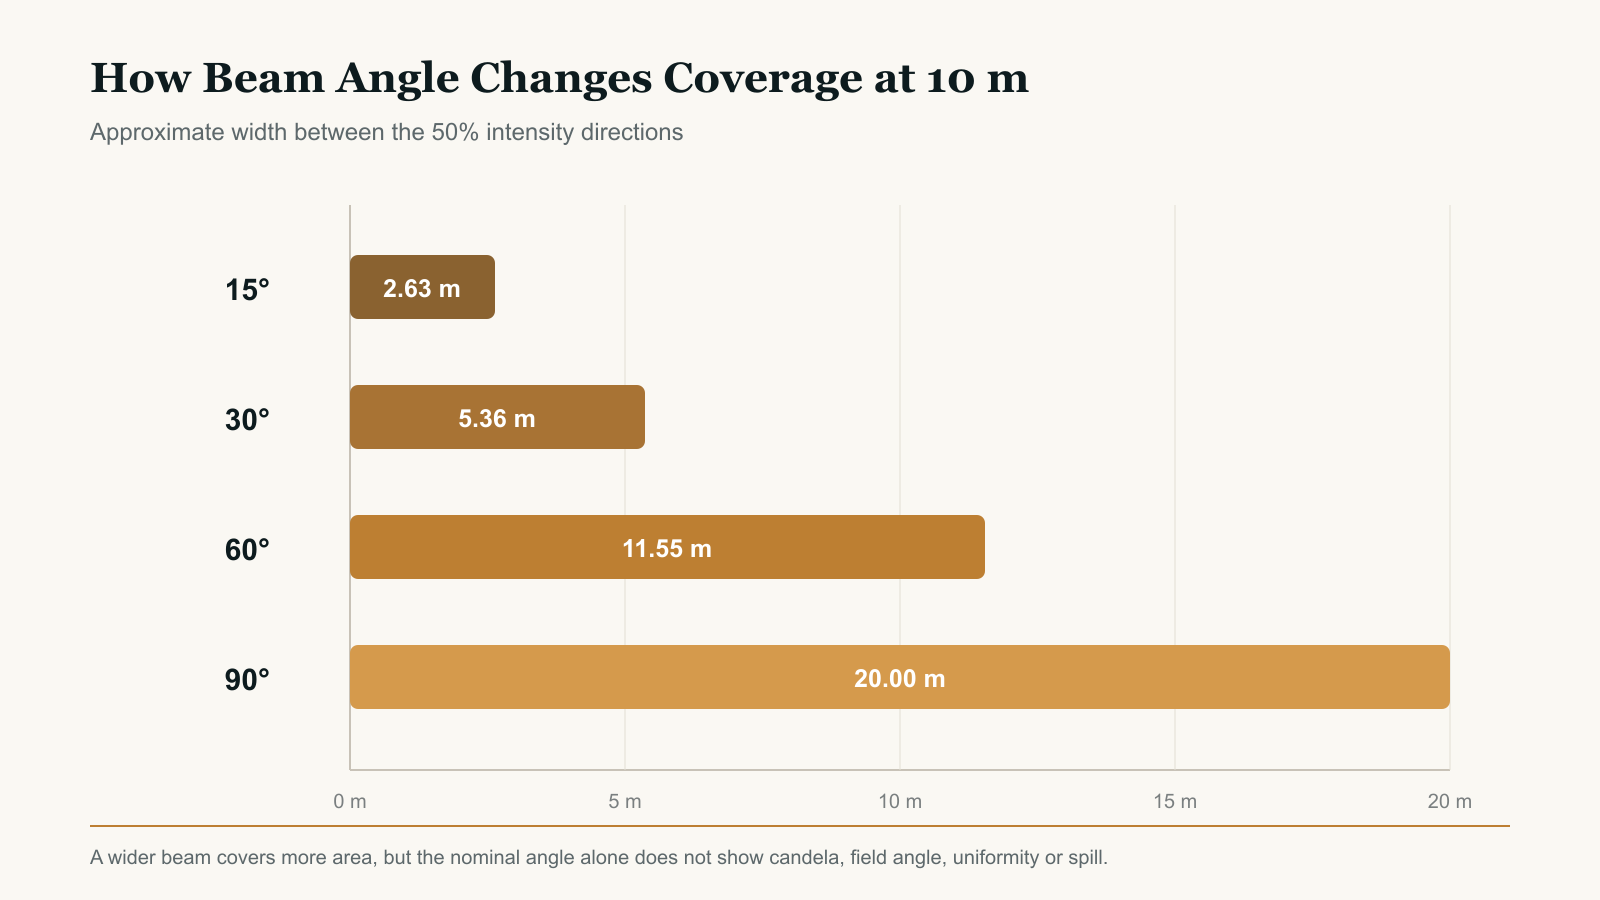
The table shows why “use a wider beam” is not always a practical answer. At the same distance, a 90° distribution covers far more area than a 30° beam, but its intensity is spread over a much larger zone.
4. Calculate Circular and Elliptical Coverage
If the symmetrical beam falls perpendicular to the target, the approximate beam area is:
For the 30° beam at 10 m:
A = π × 2.68²
A ≈ 22.6 m²
This area is bounded by the 50% intensity points. The total visible field will usually be larger.
Asymmetric beams
Some flood lights use different horizontal and vertical distributions, such as 70° × 140°.
Calculate the two dimensions separately:
The approximate elliptical area is:
This is particularly useful for wide-area, tunnel, facade and perimeter luminaires. However, an asymmetric IES distribution may not form a perfect ellipse, so the result is an early estimate rather than a final isolux boundary.
5. What Changes When the Flood Light Is Tilted?
The simple beam-width formula assumes the light is aimed straight at the target.
In real projects, flood lights are often tilted toward:
- a facade;
- the center of a parking area;
- a sports field;
- a billboard;
- a tree or monument.
Once the beam meets the surface obliquely:
- the footprint stretches;
- the near edge and far edge are at different distances;
- illuminance decreases toward the far side;
- the beam center may no longer align with the center of the visible footprint;
- a circular beam can become an irregular ellipse.
For a quick concept, calculate the distance from the luminaire to the actual aiming point rather than using only mounting height. For final coverage boundaries, use the photometric file in lighting software.
6. Formula 2: Calculate Lux from Candela
Lux is illuminance: lumens incident per square metre. For a point source and a surface perpendicular to the beam direction, the inverse-square relationship is:
Where:
E= illuminance in lux;I= luminous intensity in candela in the direction of the calculation point;D= distance in metres.
The IES describes this relationship through the inverse-square law. It also notes that the point-source approximation has distance limitations for sources of significant physical size.
Reference: IES inverse-square law
Example: 15,000 cd at 10 m
E = 15,000 ÷ 10²
E = 150 lux
At 15 m:
E = 15,000 ÷ 15²
E ≈ 66.7 lux
Distance has a squared effect. Increasing the distance from 10 m to 20 m reduces the on-axis illuminance from 150 lux to 37.5 lux, assuming the same luminous intensity.
Distance and center-lux reference
| Center intensity | 5 m | 10 m | 15 m | 20 m |
|---|---|---|---|---|
| 5,000 cd | 200 lx | 50 lx | 22.2 lx | 12.5 lx |
| 15,000 cd | 600 lx | 150 lx | 66.7 lx | 37.5 lx |
| 30,000 cd | 1,200 lx | 300 lx | 133.3 lx | 75 lx |
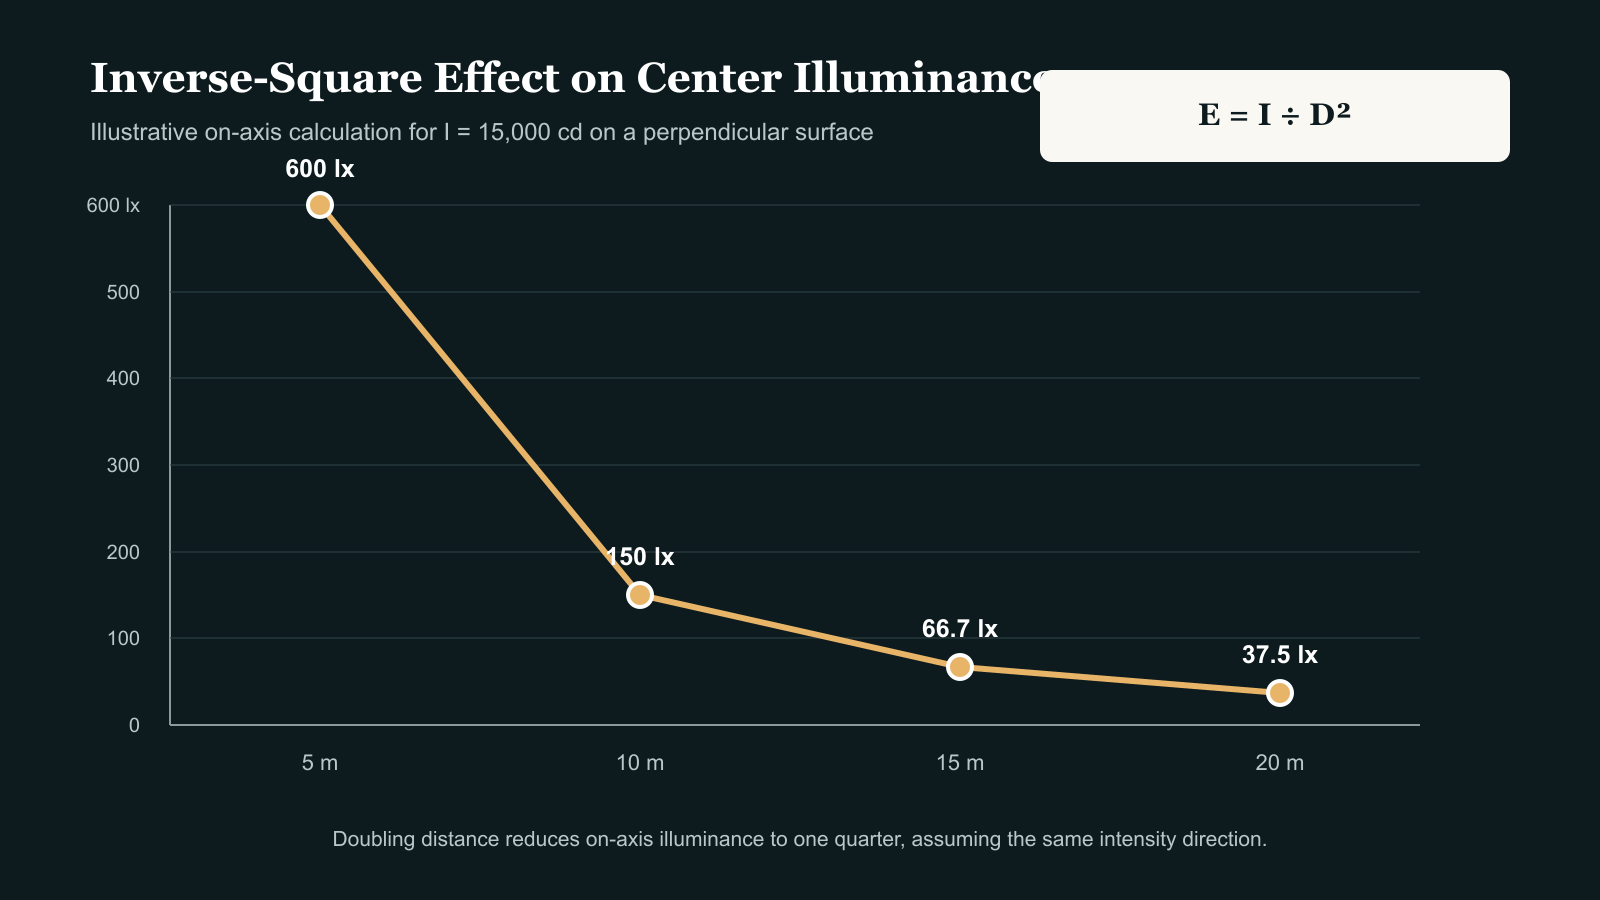
These are on-axis values on a surface normal to the incident beam. They do not represent average illuminance across the whole beam.
7. Add the Cosine Correction for an Angled Surface
When light reaches a surface at an angle, the same beam is distributed over a larger projected area.
A useful point calculation is:
Where:
I(γ)= luminous intensity toward the calculation point;α= angle between the incident light and the surface normal;D= actual distance from luminaire to calculation point.
Example
Assume:
- intensity toward the point = 18,000 cd;
- distance = 12 m;
- incidence angle from the surface normal = 30°.
E = 18,000 × cos(30°) ÷ 12²
E ≈ 108 lux
Using center intensity for every point would be incorrect. Off-axis points require the candela value in that direction, which is one reason the full photometric distribution is necessary.
8. Why Lumens Alone Cannot Predict Lux
Lumens describe total light output. Lux describes how much of that output arrives on a surface.
The same 6,000-lumen package can produce:
- a narrow, high-intensity beam;
- a broad, low-intensity flood;
- an asymmetric roadway distribution;
- a wall-wash distribution;
- substantial spill outside the useful target.
Without the intensity distribution, lumens cannot show throw distance, hot spots, beam edges or uniformity.
For project comparison, request:
| Data | What it tells the buyer |
|---|---|
| Luminaire lumens | Total output leaving the complete fixture |
| Wattage | Electrical input and connected load |
| Luminaire efficacy | Output per watt for the complete luminaire |
| Maximum intensity | Peak candela and potential throw |
| Candela table/curve | Intensity in different directions |
| Beam and field angles | Width at the 50% and 10% intensity points |
| IES/LDT file | Full distribution for calculation software |
| Test configuration | Exact LED, optic, driver, cover and operating condition represented |
9. Formula 3: Estimate Fixture Quantity
A preliminary lumen-method estimate is:
Where:
N= preliminary number of luminaires;Eavg= target average illuminance in lux;A= target area in square metres;F= luminaire lumens per fixture;UF= utilization factor, the proportion of light reaching the useful calculation area;MF= maintenance factor for lumen depreciation, dirt and operating conditions.
Worked example
Assume:
- target area = 20 m × 12 m = 240 m²;
- target average illuminance = 80 lux;
- luminaire output = 6,000 lm;
- preliminary utilization factor = 0.45;
- maintenance factor = 0.80.
N = 80 × 240 ÷ (6,000 × 0.45 × 0.80)
N ≈ 8.9
The calculation rounds up to 9 luminaires as an initial flux estimate.
It does not prove that nine fixtures will meet:
- minimum illuminance;
- uniformity;
- glare limits;
- spill-light restrictions;
- vertical illuminance;
- target-specific standards.
The layout may need more luminaires at lower output, different optics, changed positions or cross-aiming. Do not turn the rounded lumen-method result directly into a purchase quantity.
10. Do Not Guess the Utilization Factor
Utilization factor has a strong effect on the result.
If the example above uses:
UF = 0.60, the estimate is about 6.7 fixtures;UF = 0.45, the estimate is about 8.9 fixtures;UF = 0.30, the estimate is about 13.3 fixtures.
A generic factor copied from another project can therefore change the order quantity dramatically.
Outdoor utilization depends on:
- optic and aiming;
- luminaire position;
- target shape;
- obstruction;
- spill beyond the calculation boundary;
- surface orientation;
- reflections, if included in the calculation method.
Use a cautious preliminary value only for budgeting, and replace it with an IES/LDT-based calculation before approval.
11. Uniformity Determines Spacing
Average lux can hide poor lighting quality.
A layout may achieve the required average while still having:
- one intense hot spot below each luminaire;
- dark zones between beams;
- low vertical visibility;
- excessive glare toward users or neighbors.
Uniformity is commonly expressed using ratios such as minimum-to-average or minimum-to-maximum illuminance. The applicable metric and target should come from the project brief or relevant standard.
Beam overlap is necessary, but a fixed rule such as “space lights one beam diameter apart” is unreliable. Edge intensity differs between optics, and the beam diameter only describes the 50% intensity points.
For a preliminary layout:
- place luminaires around the project boundary or mounting positions;
- aim each luminaire at a defined point;
- calculate beam footprints at the actual throw distances;
- check how the fields overlap;
- evaluate dark zones and spill;
- verify the grid using the exact photometric file.
12. A Practical Three-Level Workflow

Level 1: Geometry check
Use beam angles and distances to determine whether the proposed optic can physically cover the target.
Best for:
- early feasibility;
- comparing narrow and wide candidates;
- estimating aiming zones;
- preparing a sample request.
Level 2: Point lux check
Use candela and the inverse-square law to estimate illuminance at critical aiming points.
Best for:
- checking potential throw;
- comparing different intensities;
- screening obviously underpowered configurations.
Level 3: Photometric simulation
Import the exact IES or LDT file into professional lighting software and model: